Documentation menu
Getting started
Writing evals
Tooling
Going further
Dashboard
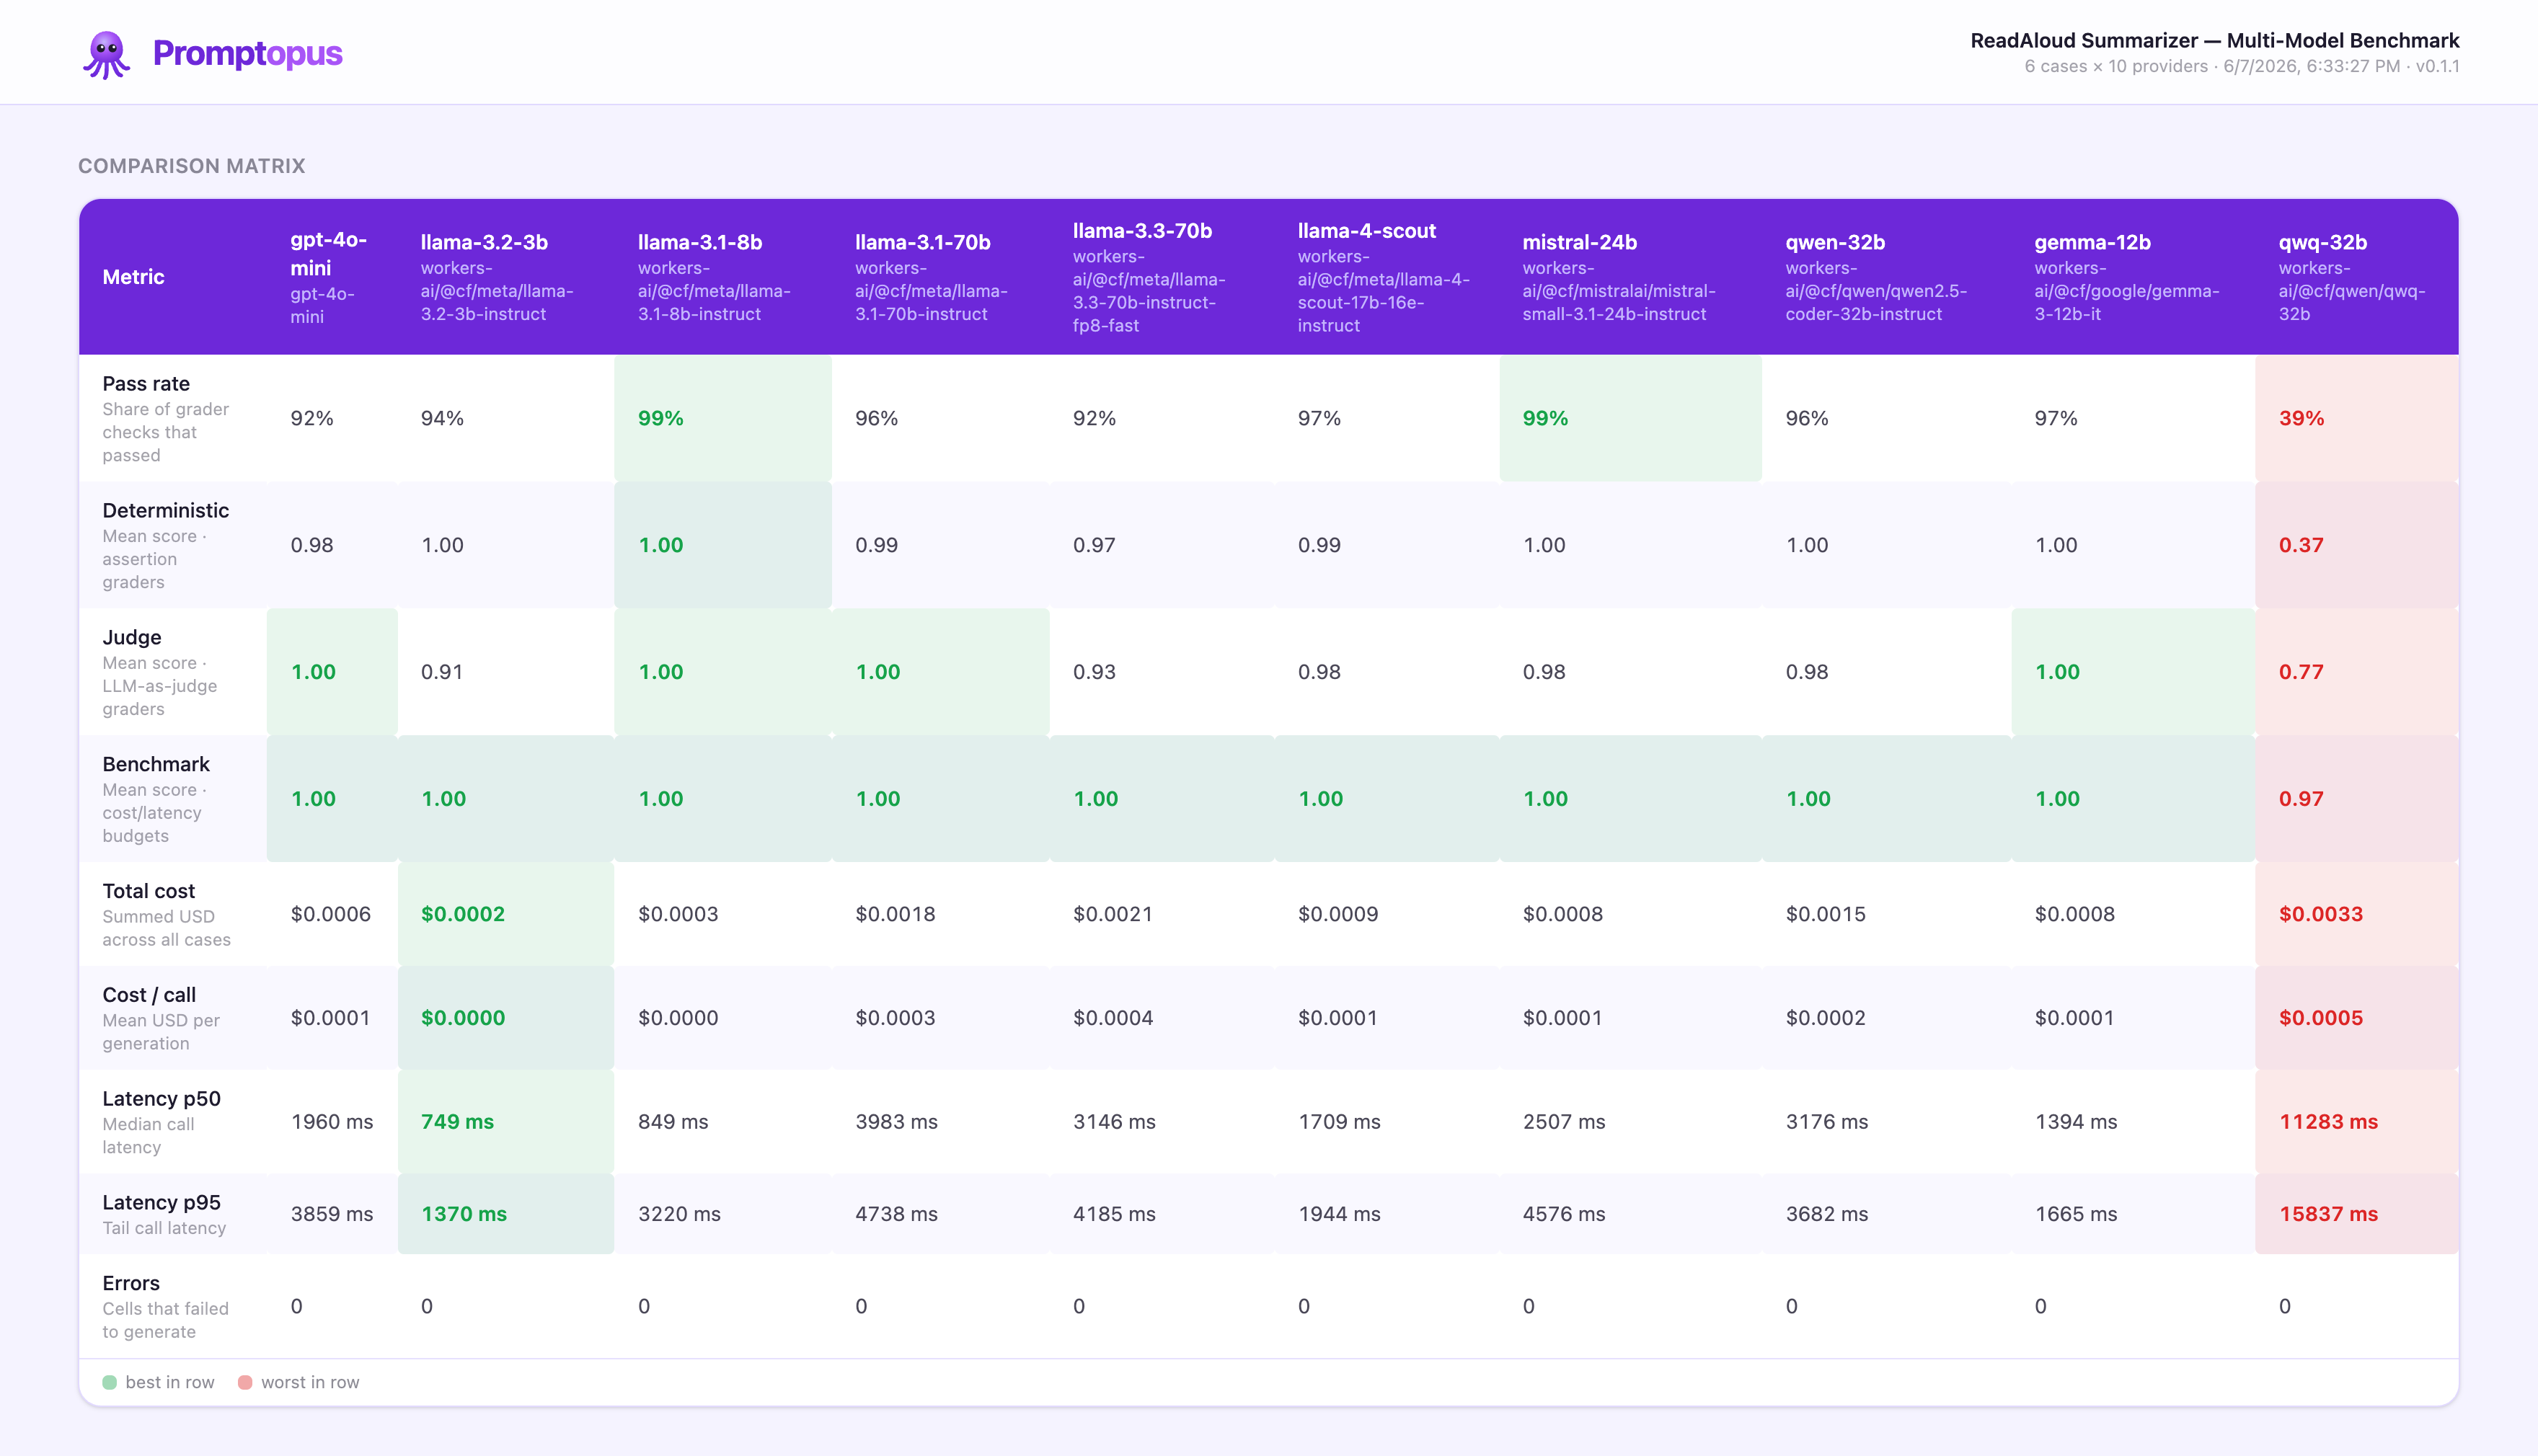
The static comparison dashboard — matrix, drill-down, and loading a report.
The dashboard is a static React app (Vite + Tailwind) that reads a JSON report and renders a side-by-side comparison. It needs no backend.
Opening it
The easiest way is the CLI, which serves the dashboard and your report together:
promptopus view results/results.jsonYou can also run the dashboard’s dev server directly and load a report via the file picker, or place a
report at apps/dashboard/public/report.json so it loads by default.
Comparison matrix
The top section is a matrix: providers are columns, metrics are rows. Each row is highlighted best-in-row (green) and worst-in-row (red) so tradeoffs jump out:
- Pass rate — fraction of grader checks that passed.
- Score · deterministic / judge / benchmark — mean score per grader family (
—if the family was unused). - Cost — total and mean USD per call.
- Latency — p50 and p95 (and mean, in the report).
- Errors — cells that failed to generate.
Because every metric draws from the same report, what you see matches results.json exactly.
Case drill-down
Below the matrix, a row of case pills (each showing that case’s pass rate) lets you drill in. For the selected case you get:
- the prompt, and the source / reference when present;
- each provider’s raw output side by side;
- every grader result — its family chip, ✓/✗, score, and detail;
- that call’s latency, cost, and token counts.
Error cells are shown distinctly with the captured error message, so a failed provider is visible rather than silently missing.
Loading your own report
The app fetches report.json relative to where it’s served. promptopus view <file> wires your chosen
file to that path. Reports are plain JSON conforming to the Report type, so anything that produces a
valid report (including a custom pipeline using @promptopus/core’s buildReport) can be visualized.
Types are shared
The dashboard imports the Report, ProviderSummary, and RunResult types directly from
@promptopus/core, so the artifact shape has a single source of truth — the report you generate and
the UI that renders it can’t drift.
Next: Extending.